Money Mapping is a Visual Merchandising data goldmine, we explore how it works, and how artificial intelligence is making Money Mapping more accessible for retailers.
AI-Enabled Money Mapping – New Insights for Visual Merchandising, New Data for Driving Sales
Visual Merchandising’s Data Problem
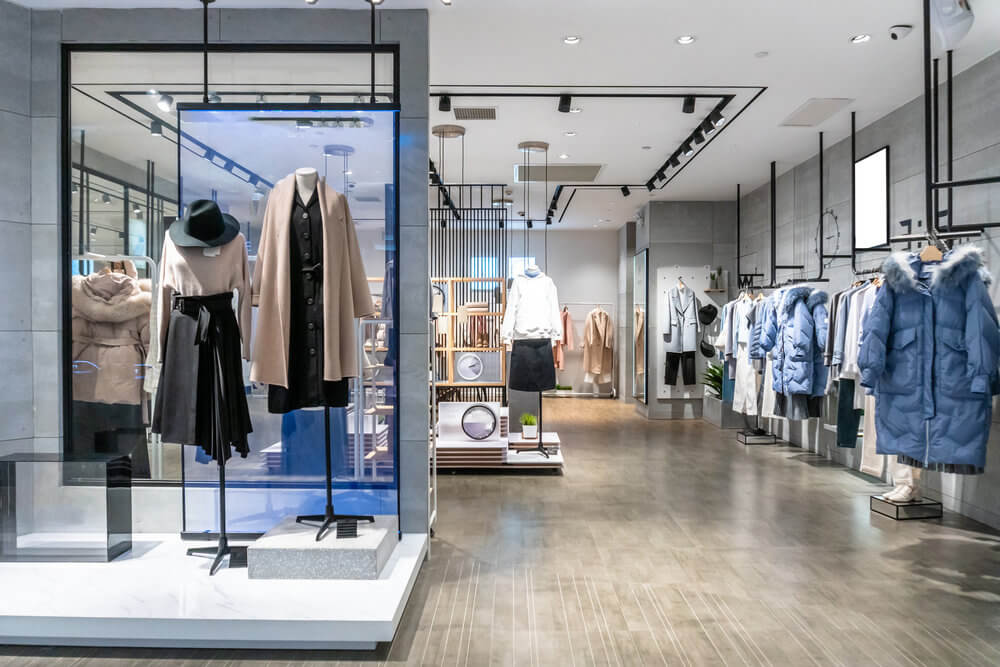
Visual merchandising is one of the ‘dark arts’ of retail. For the uninitiated, it’s the practice of designing visually appealing sales floors and store fixtures that attract customers and ultimately sell the products on display. It’s a subjective and artistic means of delivering a concrete KPI – sales.
One of the challenges of visual merchandising is data, experimentation & design is all well and good, but not if you have no way of knowing what does and doesn’t work. Sales data is always a good place to start, but there are so many other factors at play that it’s often unwise to attribute visual merchandising to an increase or decrease of sales to a single product. You have to go one step further…
What is Money Mapping?
So, how do you measure the sales performance of a store based on its layout and design?
First, you map out the sales floor with the exact location of products. Then you break the map of the store into ‘zones’, typically around certain fixtures, shelves and displays. These zones can consist of several different items, grouped by either category or style depending on the design of the store.
You then collate the sales of every item in this zone and compare it to others in the same store. The result? An impression of shop floor sales broken down by areas of the store.
This is called ‘Money Mapping’ and allows retailers to visualise and analyse which areas of a store are ‘hotspots’ and which are ‘cold’ in terms of sales. This gives an initial view of which areas and fixtures are selling products and which aren’t.
To account for other external influences on sales, best practise is to swap items between fixtures or observe a ‘money map’ over a long time, as collections and merchandise changes between seasons. This way, if the localised sales data remains relatively similar even after products have rotated, then it’s clear the design or locations of the fixture is having an impact.
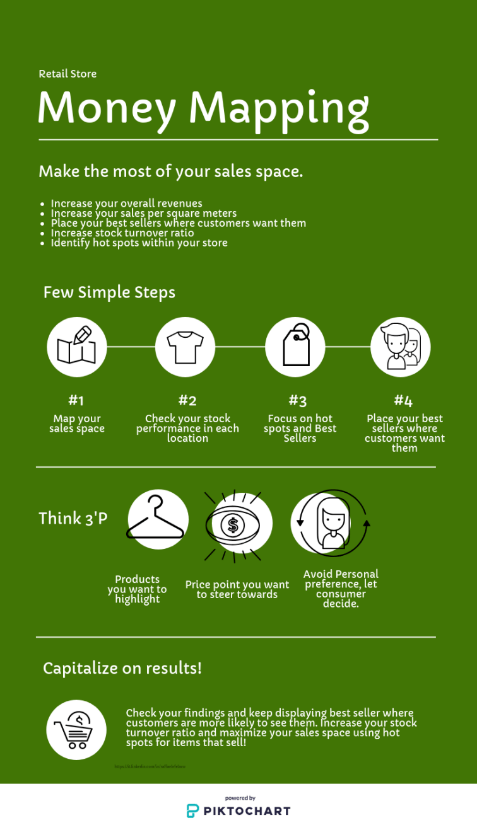
What are the benefits of Money Mapping?
- Insight on consumer experience
- Provides valuable data for visual merchandisers
- Breaks down areas of sales floor by sales performance
- Can be used to optimise store layout
- Drives Sales
- Can compare Product Placement & Visual Merchandising
- Can be used to conduct A/B tests
This all sounds great, so why doesn’t every retailer and every store do this already? The simple answer – the process of matching the sales data to specific locations on the sales floor, manually for every item and every store, is logistically a big ask. This means, if this can be done at all by visual merchandisers, it can only be done in a small number of stores.
How does AI change money mapping?
So how can we solve this data problem for visual merchandisers and make ‘Money Mapping’ easier and more accessible for retailers?
The first issue is having an accurate map of a store which includes exactly where every single item is sold from. Traditionally this would have to be done manually, and then have the sales data of items cross-referenced with their location in a store.
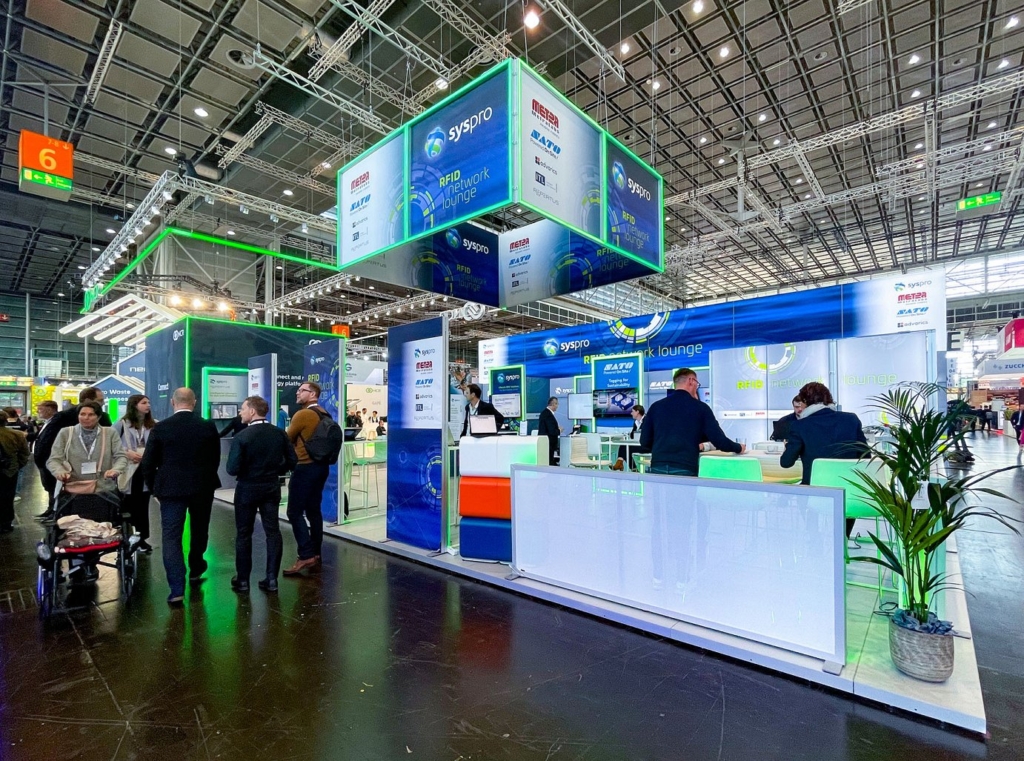
The solution: Using RFID (Radio Frequency Identification) and AI localisation techniques, we can now create a map of a store as part of the daily or weekly stock count.
This is done by adding ‘reference’ RFID tags into the store. Small tags just like ones that go on products are placed on fixtures and walls in the store. Because these never move, we can use the signal strength (relative to the fixtures) from stock counts to map exactly where items are in the store and what items they are grouped with.
This location info is then integrated with data from point of sale to generate an automated Money Map of a store, as part of the regular reporting and analytics function of the store. This can be done for as many stores as desired. With the data collection automated, visual merchandisers can focus on using the data to optimise product placement and store design across stores.
With larger data sets to work with, this also opens up the potential for more detailed analysis and experimentation such as A/B testing product combinations and store layouts!
What’s the process for AI Money Mapping?
- Attach reference RFID tags to walls and fixtures within the store
- Perform regular RFID stock takes as normal
- Software uses machine learning to ‘map’ out item locations within the store
- Integrate point of sale data with RFID software
- Software produces ‘heat map’ of the store based on sales
- Visual merchandisers can use data to inform strategy and measure results
")
Conclusion
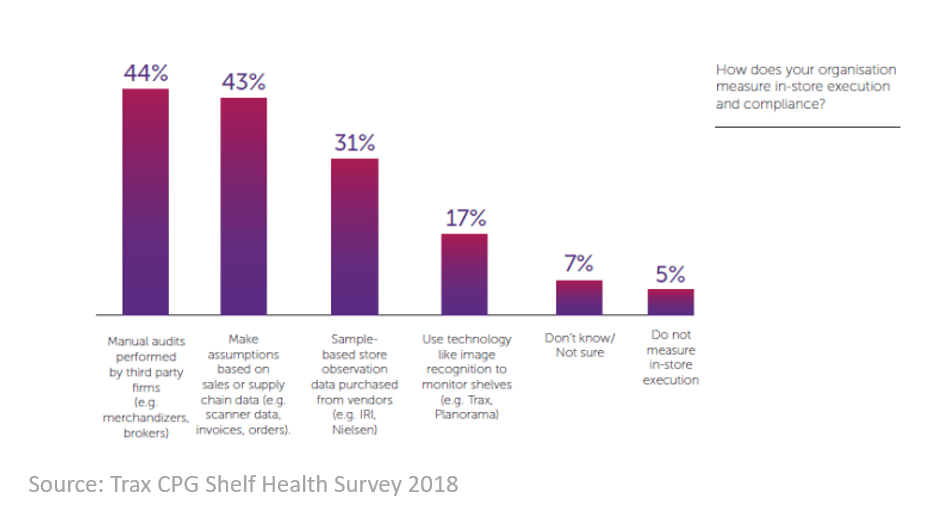
Visual merchandising is a subtle but valuable process for retailers. Done properly it has a huge impact on both sales, customer experience and brand image. The only problem with this is visual merchandisers often don’t have enough data to measure performance and identify where their attention is needed most. The data they can collect is either time consuming, expensive or inaccurate.
Artificial intelligence changes the game for visual merchandising. By utilising RFID tags and Machine Learning, it is possible to ‘map out’ the location of items in a store, and more importantly, the sales distribution of the shop floor. These ‘Money Maps’ tell visual merchandisers what areas of the sales floor are ‘hotspots’ for sales and which are underperforming. Using this data, they can then focus their attention on improving the design or layout of certain areas.
Additionally, with this data stores can look to leverage their sales hotspots either by prioritising the best locations for best-sellers, high-value items or items that are due to go out of season.
Either way, AI-enabled Money Mapping is another important evolution in retail data and analytics. Providing retailers with unprecedented insight into exactly what goes on in Brick and Mortar Stores.

Thanks for the article on AI-Enabled Money Mapping – New Insights for Visual Merchandising, New Data for Driving Sales.Looking forward for more articles like this.